Emission calculations for Public Electricity and Heat
The first in a series of posts replicating the sector-by-sector computation of Canada's National Greenhouse Gas Inventory: Public Electricity and Heat. As it is first, it also introduces the sectors of the IPCC reporting guidelines, and the 71 sectors with which Canada reports its greenhouse gas inventory.
Note on NIR: In the context of this post, the acronym "NIR" refers to the 2025 version of Canada's National Inventory Report. While new reports are released annually and PlanZero modelling will incorporate these future releases over time, the content of this post is left as is in reference to the 2025 version of the report.
Table of Contents:
Introduction
A high-level reminder: I would like for PlanZero to be able to evaluate business and product ideas in terms of their ability to support Canada's net-zero targets. My approach is:
- estimating the official national inventory calculation based on public data from Statistics Canada (StatsCan) and Natural Resources Canada (NRCan), and then
- evaluating the effect of hypothetical business and product ideas in terms of those foundational StatsCan and NRCan statistics.
This post is the first in a series devoted to estimating Canada's national greenhouse gas inventory in this open-source PlanZero software repository (implemented in the Python programming language). It introduces the set of sectors uses by Environment and Climate Change Canada (ECCC), and replicates the calculation of emissions associated with "Public Electricity and Heat" for years 2005 to present. Some of the content of this post has been used to refresh the IPCC Sectors / Public Electricity and Heat Production page.
IPCC Sectors Guidelines
Canada's National Greenhouse Gas Inventory is reported in keeping with the IPCC Guidelines for National Greenhouse Gas Inventories. (Technically, the 2019 Refinement to the 2006 IPCC Guidelines for National Greenhouse Gas Inventories). The IPCC reporting guideline introduces a hierarchical taxonomy of emissions sources, the highest two levels of which are as follows:
- Energy
- Stationary combustion
- Mobile combustion
- Fugitive emissions
- transport, injection, and storage
- Industrial Processes and Product Use
- Mineral industry emissions
- Chemical industry emissions
- Metal industry emissions
- Non-energy products from fuels and solvent use
- Electronics industry emissions
- Emissions of fluorinated substitutes for ozone-depleting substances
- Other product manufacture and use
- Agriculture, Forestry, and Other Land Use
- Forest land
- Cropland
- Grassland
- Wetlands
- Settlements
- Other land
- Emissions from livestock and manure management
- emissions from managed soils and emissions from lime and urea application
- Harvested wood products
- Waste
- Waste generation, composition, and management data
- Solid waste disposal
- Biological treatment of solid waste
- Incineration of solid waste
- Wastewater treatment and discharge
The IPCC guidelines describe how countries should measure greenhouse gases in all of these areas, and the taxonomy within areas goes deeper. For example, within "Energy / Stationary Combustion Sources", the 2006 guideline (pdf) enumerates 20-or-so coded sub-categories, which countries can use individually or in combination in order to characterize their emissions: electricity generation, petroleum refining, manufacturing industries and construction, combustion within commercial and residential buildings, and so on. For another example, within "Energy / Mobile Combustion", the guidelines enumerate vehicle types from consumer cars and trucks, to heavy duty diesel-burning trucks, to off-road vehicles used in mining, to emissions from rail, aviation, and marine vessels. (The guidelines from 2006 were evidently largely clear and complete, because they weren't updated until 2019, and even then the updates appear to be minor. Good job, IPCC.)
Canada's IPCC Sectors
Canada reports emissions in terms of 71 IPCC sectors, the complete set of which is listed below. We saw the IPCC Sectors making up Canada's emissions in the previous post, Paris Agreement and the CNZEAA; the stacked area figure had a coloured region for each sector, emphasizing the sectors with the largest emissions in terms of . There is temporal variance: the magnitude of emissions from sector to sector and year to year can sometimes vary by over 10% of Canada's entire emissions (especially the land use sectors). There is also consistency: historically, Canada has a lot of emissions from the stationary and mobile combustion of fossil fuels for energy. Also, not all sectors have similar sizes: emissions associated with several sectors have been consistently nearly-negligible, such as e.g. industrial wastewater treatment and discharge, the incineration and open burning of waste, and, of all things the transportation and storage of .
Admittedly it makes for dry reading, but for completeness, here are the 71 IPCC sectors with which Canada represents its greenhouse gas inventory:
- Energy / Stationary Combustion / Public Electricity and Heat
- Energy / Stationary Combustion / Petroleum Refining Industries
- Energy / Stationary Combustion / Oil and Gas Extraction
- Energy / Stationary Combustion / Mining
- Energy / Stationary Combustion / Manufacturing / Iron and Steel
- Energy / Stationary Combustion / Manufacturing / Non-ferrous Metals
- Energy / Stationary Combustion / Manufacturing / Chemical
- Energy / Stationary Combustion / Manufacturing / Pulp and Paper
- Energy / Stationary Combustion / Manufacturing / Cement
- Energy / Stationary Combustion / Manufacturing / Other Manufacturing
- Energy / Stationary Combustion / Construction
- Energy / Stationary Combustion / Commercial and Institutional
- Energy / Stationary Combustion / Residential
- Energy / Stationary Combustion / Agriculture and Forestry
- Energy / Mobile Combustion / Air / Domestic Aviation (Civil)
- Energy / Mobile Combustion / Air / Military
- Energy / Mobile Combustion / Road / Light-Duty Gasoline Vehicles
- Energy / Mobile Combustion / Road / Light-Duty Gasoline Trucks
- Energy / Mobile Combustion / Road / Heavy-Duty Gasoline Vehicles
- Energy / Mobile Combustion / Road / Light-Duty Diesel Vehicles
- Energy / Mobile Combustion / Road / Light-Duty Diesel Trucks
- Energy / Mobile Combustion / Road / Heavy-Duty Diesel Vehicles
- Energy / Mobile Combustion / Road / Motorcycles
- Energy / Mobile Combustion / Road / Propane and Natural Gas Vehicles
- Energy / Mobile Combustion / Rail
- Energy / Mobile Combustion / Marine / Domestic Navigation
- Energy / Mobile Combustion / Marine / Fishing
- Energy / Mobile Combustion / Marine / Military
- Energy / Mobile Combustion / Other / Agriculture and Forestry
- Energy / Mobile Combustion / Other / Commercial and Institutional
- Energy / Mobile Combustion / Other / Off-Road Manufacturing, Mining and Construction
- Energy / Mobile Combustion / Other / Off-Road Residential
- Energy / Mobile Combustion / Other / Off-Road Other Transportation
- Energy / Mobile Combustion / Other / Pipeline Transport
- Energy / Fugitive Emissions / Coal Mining
- Energy / Fugitive Emissions / Oil
- Energy / Fugitive Emissions / Natural Gas
- Energy / Fugitive Emissions / Venting
- Energy / Fugitive Emissions / Flaring
- Energy / Transport and Storage
- Industrial Processes and Product Use / Mineral Industry Emissions / Cement Production
- Industrial Processes and Product Use / Mineral Industry Emissions / Lime Production
- Industrial Processes and Product Use / Mineral Industry Emissions / Mineral Product Use
- Industrial Processes and Product Use / Chemical Industry Emissions / Ammonia Production
- Industrial Processes and Product Use / Chemical Industry Emissions / Acid Production
- Industrial Processes and Product Use / Chemical Industry Emissions / Adipic Acid Production
- Industrial Processes and Product Use / Chemical Industry Emissions / Petrochemical and Carbon Black Production
- Industrial Processes and Product Use / Metal Industry Emissions / Iron and Steel Production
- Industrial Processes and Product Use / Metal Industry Emissions / Aluminium Production
- Industrial Processes and Product Use / Metal Industry Emissions / Magnesium Production and Casting
- Industrial Processes and Product Use / Production and Consumption of Halocarbons, SF6 and NF3
- Industrial Processes and Product Use / Non-Energy Products from Fuels and Solvent Use
- Industrial Processes and Product Use / Other Product Manufacture and Use
- Agriculture / Enteric Fermentation
- Agriculture / Manure Management
- Agriculture / Agricultural Soils (Direct)
- Agriculture / Agricultural Soils (Indirect)
- Agriculture / Field Burning of Agricultural Residues
- Agriculture / Liming, Urea Application and Other Carbon-Containing Residues
- Waste / Municipal Solid Waste Landfills
- Waste / Industrial Wood Waste Landfills
- Waste / Biological Treatment of Solid Waste
- Waste / Incineration and Open Burning of Waste
- Waste / Municipal Wastewater Treatment and Discharge
- Waste / Industrial Wastewater Treatment and Discharge
- Land Use, Land Use Change, and Forestry (LULUCF) / Forest Land
- Land Use, Land Use Change, and Forestry (LULUCF) / Cropland
- Land Use, Land Use Change, and Forestry (LULUCF) / Grassland
- Land Use, Land Use Change, and Forestry (LULUCF) / Wetland
- Land Use, Land Use Change, and Forestry (LULUCF) / Settlements
- Land Use, Land Use Change, and Forestry (LULUCF) / Harvested Wood Products
The emissions in these sectors make up Canada's national greenhouse gas inventory. The total reported annually to the Secretariat of the UN Framework Convention on Climate Change (UNFCCC) excludes the "Land Use, Land Use Change, and Forestry" (LULUCF) contributions, but the federal targets set by Environment and Climate Change Canada (ECCC) are inclusive of all 71 sectors.
Public Electricity and Heat
With the overview of sectors complete, let me come back to my main purpose with the post, which is to start replicating the computation of Canada's emissions in these sectors, in order of their contribution to the 2005 total. (I chose year 2005 because it is the baseline year for Canada's emission-reductions targets.) The largest single-sector contributor of in 2005 in Canada was the stationary combustion of fossil fuels for the purpose of producing public electricity and public heat. The sector was responsible for 124 megatonnes of (Mt ) that year. As is typical of fossil combustion, about 99.5% of the is itself, with the remainder coming from tiny amounts of methane and nitrous oxide. Public electricity dominated the emissions, rather than public heat, although there are district heat systems in Toronto, Montreal, and Vancouver, and this sector includes their emissions. The emissions from public electricity generation historically have mostly been from the combustion of coal (heating water, creating steam to drive a turbine) although recently natural gas has become the leading cause of emissions (the gas can be combusted purely for heat and steam, but usually it is injected into a combustion turbine like a jet engine, and sometimes the heat from the combustion turbine is used to also drive a steam turbine).
A static figure and link to what's now an interactive infographic at IPCC Sectors / Stationary Combustion Sources / Public Heat and Electricity:
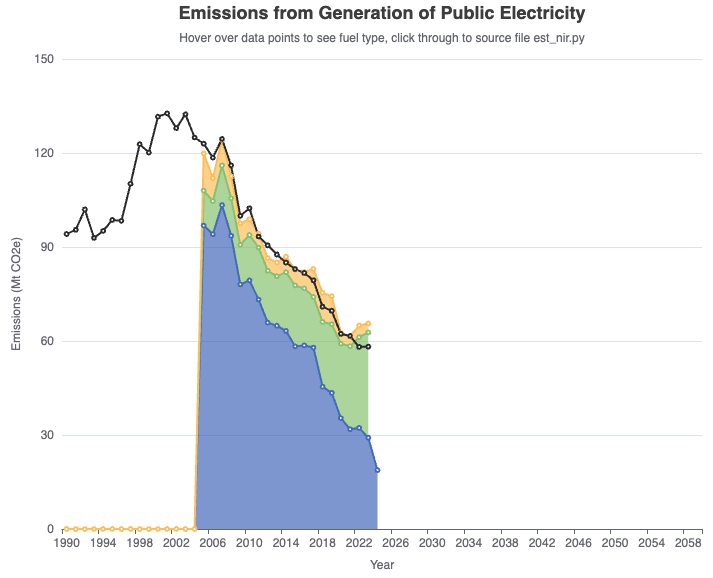
The stacked bar chart in the figure above is my attempt to replicate the ECCC's sector total (shown in solid black near the top). Emissions for the sector were generally calculated by multiplying greenhouse gas emission factors by amounts of fuel combusted. The data for this estimate comes from a handful of sources:
- Annex 6 of the 2025 national inventory report lists the emissions factors for different fuels, sometimes varying by year, by province, by application, or by combustion technology (e.g. residential vs. industrial wood combustion).
- "Electric Power Generation, Annual, Fuel Consumed by Electric Utilities" (StatsCan 25-10-0017-01) provided data for years 2005-2022 for all fuel types, except natural gas.
- "Electric Power, Annual, Generation by Class of Producer" (StatsCan 25-10-0020-01) supported an accurate estimation for years 2005-2014 relating to natural gas, but only by including both utility and industry consumption. To use this data source, I had to approximate natural gas consumption using thermal efficiency assumptions: by default I assumed 30% for plants in Alberta (conjecturing that steam would be used to move heat into oil sands rather than create additional electricity), and 50% for Ontario (where more combined-cycle turbines were in operation).
- "Supply and Demand of Primary and Secondary Energy" (StatsCan 25-10-0030-01) provided natural gas consumption by electric utilities for years 2015-2024, and allowed my estimate to match the National Inventory Report (NIR) total when only including utility consumption. In contrast StatsCan 25-10-0020-01, the estimates using this data were poor when including both utility and industry consumption.
- "Electric power generation, fuel consumed and cost of fuel by electricity generating thermal plants" (StatsCan 25-10-0084-01) provided consumption data for other fuels for years 2020-2024. Consumption data for prior years was drawn from StatsCan 25-10-0017-01. Both tables offer data on years 2020-2022, and I chose to use this newer table for those years.
The emissions of each gas were combined into using the coefficients introduced in the earlier PlanZero post on GHGs. I did not include the contribution to this sector from district heating systems (e.g. in Toronto, Montreal, Vancouver) for two reasons: (1) as the impact of these systems on the national calculation appears to be smaller than the current fitting error, and (2) data on the fuel consumption of these systems is not yet incorporated into PlanZero.
There is a divergence between my estimate and the NIR sectoral total in the latest couple of years, driven by a sharp uptick in natural gas usage. Both of datasets 25-10-0030-01 (which I used for natural gas consumption) and 25-10-0084-01 do show a remarkable recent increase in the use of natural gas. The usage of natural gas for electricity generation by utilities appears to have almost doubled nation-wide from 2020 to 2024. The increase is largest in Alberta, but the increase in Ontario is also large. I don't know why this uptick does not show up in the national inventory reference data, I might be overestimating emissions from to coal combustion.
It is encouraging to see the downward trend over the last two decades in emissions from this sector, but the figure shows only 17 more Mt of annual emissions from coal combustion can be eliminated. The strategy of replacing coal plants with natural gas turbines is reducing emissions for now, but the strategy will not get us to net zero. Troublingly, the emissions from natural-gas-powered plants have been rising sharply in recent years. I have yet to incorporate the emissions projections from the provincial and territorial utilities, but based simply on this recent investment in gas turbine capacity, I would expect emissions in this sector to remain in the 40-60 Mt range for many years. Unless there's a huge breakthrough in carbon sequestration, we will have to find sources of lower-emission electricity both to handle ever-increasing demand, as well as to replace those gas turbine plants as they reach end-of-life in the decades ahead.
Summary
This post introduced the sectors recommended by the IPCC reporting guidelines, and enumerated all 71 sectors used by the ECCC to represent Canada's national greenhouse gas inventory. It presented the first attempt in PlanZero to replicate a sectoral emissions calculation from that national inventory: public electricity and heat. The basic mathematics of the emission calculation is straightforward: a weighted sum of amounts of fuel consumed multiplied by emissions factors of each greenhouse gas for each fuel. The implementation is complicated by the emissions factors being presented in various sizes and natures of tables, and by the fuel consumption being stored in multiple StatsCan products covering different time periods, and with overlapping but somewhat different semantics. Still, the required data seems by and large to be public, and the prescribed arithmetic gave rise to roughly the desired result. I look forward to complementing and extending the time series involved in this calculation with the emissions projections from provincial and territorial electric utilities, and modelling how Canada might be powered in the decades to come, but I will wait until I have made more progress in understanding the remaining sectors. Coming up in the next post will be a similar modelling summary of Canada's next-largest emissions-contributing sector from 2005: forest land.